Selected Topics in Applied Econometrics
Summary
Excerpt
Table Of Contents
- Cover
- Title Page
- Copyright Page
- Preface
- The Referees Committee
- About the editors
- About the book
- Citability of the eBook
- Contents
- List of Contributors
- 1 Multi-Dimensional Panel Data Models: The Case of Borsa Istanbul
- 2 Heterogenous Multi-Dimensional Panel Data Models: Okun’s Law for NUTS2 Level in Europe1
- 3 A Comparison Between ML-SEM and GMM: Military Expenditures and Economic Growth Nexus Revisited
- 4 Is Per Capita Real GDP Stationary in the D-8 Countries? Evidence from a Panel Unit Root Test
- 5 Detecting Housing Price Bubbles Using Panel Unit Roots Tests
- 6 Estimation and Testing of Nonparametric Panel Data Models: Applications for Worldwide Production Function
- 7 The Expectations Hypothesis of the Term Structure of Interest Rates: Evidence from the Fourier Cointegration Test
- 8 Do the Lag Lengths Matter in Terms of Size and Power Properties of Nonlinear Unit Root Tests?
- 9 Analysis of the Chaotic Behavior for BIST 100
- 10 Multivariate Stochastic Volatility Models: An Empirical Application for Foreign Exchange Rates1
- 11 Investigating Asymmetries in European Money Demand: A Threshold Cointegration Approach1
- 12 An I(2) CVAR Analysis of the Real Exchange Rate Persistence in Turkey
- 13 Deep Learning for Time Series Forecasting
- 14 Are Exports and Imports of Turkey Cointegrated? Evidence from Fourier Cointegration
- 15 An Investigation on Students’ Academic Performance via Lasso-Type Regression Analysis Methods
- 16 The Spatial Econometric Analysis of Internal Migration of Provinces in Turkey
- 17 The Relationships between Innovative Values and Outputs: A Structural Equation Modeling Approach2
- 18 Parametric and Semiparametric Logit Models: An Empirical Application on Stock Returns
- About the Authors
- References
Prof. Dr. Ebru Çağlayan Akay
Marmara University, Faculty of Economics, Department of Econometrics, İstanbul, Turkey, E-mail: ecaglayan@marmara.edu.tr
Prof. Dr. Selahattin Güriş
Marmara University, Faculty of Economics, Department of Econometrics, İstanbul, E-mail: sguris@marmara.edu.tr
Prof. Dr. Burak Güriş
İstanbul University, Faculty of Economics, Department of Econometrics, İstanbul, E-mail: bguris@istanbul.edu.tr
Prof. Dr. Harun Öztürkler
Kırıkkale University, Department of Econometrics, Kırıkkale, E-mail: ozturkler@alumni.american.edu
Prof. Dr. Sibel Selim
Manisa Celal Bayar University, Faculty of Economics and Administrative Sciences, Department of Econometrics, Manisa, Turkey, E-mail: sibel.selim@cbu.edu.tr
Prof. Dr. Ferda Yerdelen Tatoğlu
İstanbul University, Faculty of Economics, Department of Econometrics, İstanbul, E-mail: yerdelen@istanbul.edu.tr
Prof. Dr. Mahmut Zortuk
Kütahya Dumlupınar University, Department of Econometrics, Kütahya, E-mail: mahmut.zortuk@dpu.edu.tr.
Assoc. Prof. Dr Yetkin Çınar
Ankara University, Department of Business Administration, Ankara, E-mail: ycinar@ankara.edu.tr
Assoc. Prof. Dr. Baki Demirel
Yalova University, Department of Economics, Yalova, E-mail: bakidemirel@gmail.com
Assoc. Prof. Dr. Emre Şahin Dölarslan
Çankırı Karatekin University, Department of Business Administration, Çankırı, E-mail: dolarslan@karatekin.edu.tr
Assoc. Prof. Aycan Hepsağ
İstanbul University, Faculty of Economics, Department of Econometrics, İstanbul, E-mail: hepsag@istanbul.edu.tr
Assoc. Prof. Dr. Fatma Zeren
İnönü University, Department of Econometrics, Malatya, Turkey, E-mail: fatmazeren@gmail.com
Dr. Aygül Anavatan
Pamukkale University, Faculty of Business and Administrative Sciences, Department of Econometrics, Denizli, E-mail: aanavatan@pau.edu.tr
Dr. Verda Davaslıgil Atmaca
Çanakkale Onsekiz Mart University, Biga Faculty of Economics and Administrative Sciences, Department of Econometrics, Çanakkale, E-mail: verdaatmaca@comu.edu.tr, verdadavasligil86@gmail.com
←11 | 12→Dr. Ömer Faruk Bölükbaşı
Department of Economics, Faculty of Economics and Administrative Sciences, Recep Tayyip Erdoğan University, Rize, E-mail: omer.bolukbasi@erdogan.edu.tr
Dr. Tuğba Dayıoğlu
Nişantaşı University, İstanbul, E-Mail: tugba.dayioglu@nisantasi.edu.tr
Dr. Nebile Korucu Gümüşoğlu
İstanbul Kültür University, Department of International Trade, İstanbul, E-mail: nkorucu@gmail.com.
Dr. Semih Karacan
Kütahya Dumlupınar University, Department of Econometrics, Kütahya, E-mail: semih.karacan@dpu.edu.tr
Dr. Selin Karatepe
Yalova University, Department of Economics, Yalova, E-mail: selin.karatepe@yalova.edu.tr
Dr. Eda Yalçın Kayacan
Pamukkale University, Department of Econometrics, Denizli, E-mail: eyalcin@pau.edu.tr
Dr. Oktay Kızılkaya
Hakkari University, F.E.A.S., Department of Economics, Hakkari, E-mail: oktaykizilkaya@hakkari.edu.tr
Dr. Özge Korkmaz
Bayburt University, Faculty of Economics and Administrative Sciences, Department of Economics, Bayburt, E-mail: ozgekorkmaz@gmail.com
Dr. Sinem Güler Kangallı Uyar
Pamukkale University, Department of Econometrics,Denizli, E-mail: skangalli@pau.edu.tr
Lect. Kadriye Hilal Topal
Nişantaşı Universty, Vocational School, İstanbul, Turkey, E-mail: hilal.topal@nisantasi.edu.tr
Res. Assist. Hüseyin İçen
İstanbul University, Faculty of Economics, Department of Econometrics, İstanbul, E-mail: huseyin.icen@istanbul.edu.tr
Res. Asisst. Hüseyin İşlek
Muş Alparslan University, Department of Economics, Muş, Turkey, E-mail: huseynislek@gmail.com
Res. Assist. Gökhan Özkubat
Manisa Celal Bayar University, Faculty of Economics and Administrative Sciences, Department of Econometrics, Manisa, Turkey, E-mail: gokhan.ozkubat@cbu.edu.tr
Selahattin Güriş and Ömer Faruk Bölükbaşı
1 Multi-Dimensional Panel Data Models: The Case of Borsa Istanbul
Abstract In this section, multi-dimensional panel data models are examined from a theoretical point of view and estimation methods are explained. The effects of capital structures of firms traded on Borsa Istanbul are examined based on the multi-dimensional panel data models for the period of 2003–2016 in the application section. The other firm characteristics included as explanatory variables in the analyses are firm size, liquidity and profitability. The firms in the manufacturing industry sector are grouped under seven sub-sectors of the manufacturing industry. Estimations were made based on multi-dimensional panel data models and the unobservable sectoral effects were also included in the models. Thus, the heterogeneity of the sub-sectors of the manufacturing industry has not been neglected. According to the findings, it has been found out that the borrowing ratio representing the capital structure affects the value of the firm positively. It has also been found out that liquidity and firm size which are under the other firm characteristics in the analyses positively affect firm value whereas firm profitability negatively affects firm value.
Keywords: Multi-Dimensional Panel Data, Nested Random Effects, Firm value
JEL Code: C13, C23, G32
Introduction
A panel data model is considered to refer to a two-dimensional panel data model. The major advantages of two-dimensional panel data models consisting of a combination of time series and cross section units are the reduction of the omitted variable bias and the inclusion of heterogeneity in the model. Multi-dimensional panel data models are formed by adding a unit or a time dimension to a two-dimensional panel data model. Multi-dimensional panel data models can have multiple units and/or multiple time dimensions. Thus, heterogeneity can be taken into consideration in multi-dimensional models in all directions. The main purpose of this study is to examine the theoretical models of multi-dimensional panel data models and to explain the estimation methods.
Multi-dimensional panel data models can be classified as nested and non-nested according to nesting of units. Examples of three-dimensional panel data models with two units in which one unit is nested within the other unit and with one dimension of time are models that can be derived from data that firms ←13 | 14→are nested within sectors or where cities can be nested or grouped as regions, countries. The application area of multi-dimensional panel data models obtained from non-nested units is mostly on foreign trade gravity models. In addition to the unobservable unit effects in non-nested models, panel data models can be estimated in different specifications by taking into account the interaction with the unobservable unit effects, i.e. as a bilateral effect. The unit effect which cannot be observed as nested or grouped units can be included in the model where one unit is nested or grouped inside the other unit. In multi-dimensional panel data models, the effects of the interactive unit and the unit effects in which one unit is nested within the other unit may be included in the model under different specifications and assumptions. Thus, more comprehensive analysis can be performed with multi-dimensional panel data models compared to two-dimensional panel data models. While the unobservable unit effects can be in the model as interaction effects, the unobservable effect of the nested model in the nested units can be included in the model as the nested effect in the random effect models.
Just like it is the case with two-dimensional panel data models, multi-dimensional panel data models are estimated under the assumptions of fixed effects and random effects. In application, three-dimensional panel data models with two units and a time dimension and panel data models with more dimensions are generally referred to as multi-dimensional panel data models because they are larger in size than known two-dimensional panel data models.
In empirical studies, multi-dimensional panel data models are mainly composed of two units and a time dimension. Although models with more than three dimensions are examined theoretically and estimation methods are explained, such models are less in number compared to the three-dimensional panel data models.
In the application section, the effects of capital structures and characteristics of the firms which are traded in Borsa Istanbul on the value of firms in question are analyzed using multi-dimensional panel data models. In the literature, there are many studies in which the effects of capital structure and firm characteristics on firm value are investigated by two-dimensional panel data models. The difference of this study in comparison to other studies in the literature is the use of multi-dimensional panel data models. Thus, the unobservable firm and time effects as well as the unobservable sector effect can be included in panel data models.
The study continues with the section which examines multi-dimensional fixed effects models theoretically and explains estimation methods. Then, multi-dimensional random effects models are examined and estimation methods are explained. In the application part of the study, an application has been made using multi-dimensional panel data models obtained from nested units. The study concludes with the conclusion section.
←14 | 15→Multi-Dimensional Fixed Effects Models and Estimation Methods
As with two-dimensional panel data models, the unit and time effects in the models are also included in the model as parameters to be estimated in the models of multi-dimensional fixed effects panel data. While unobservable effects are allowed to be correlated with explanatory variables, it is assumed that there are no correlations between the error term and the explanatory variables. Thus, even if there are correlations between explanatory variables and unobservable effects, consistent estimators are obtained, provided that there is no relationship between the error term and the explanatory variables.
The majority of the multi-dimensional fixed effects models, which are estimated under different specifications in applied studies, are given together in Matyas and Balazsi (2012), Balazsi et al. (2018) and Balazsi et al. (2017b) and their estimation methods are explained in detail. In these studies, the details of the three-dimensional panel data studies obtained from the non-nested units are included and the proposed estimation methods for the three-dimensional models are extended to cover the panel data models of more than three dimensions.
Examples of multi-dimensional fixed effects models derived from nested units are the panel data obtained by firms and the grouping of firms within sectors. In this case, three-dimensional panel data models which include the sector, the firms nested or grouped within sectors, and a time dimension can be encountered. There could also be multi-dimensional panel data models with more than three dimensions depending on the application subject, the purpose of the study and the availability of the data in the multi-dimensional nested panel data models which have got a data structure with one unit grouped within another unit.
Below is a nested panel data model in which one unit is grouped within another unit.
(1) 
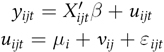
Here  M indicates the sectors and N indicates the firms inside the sectors. The number of firms in a sector may not be equal. The model structure that allows for the use of different number of firms in the sectors is below
  is the unobservable unit effect of the i. sector and
  is the unit effect of the j. firm in the i. sector.
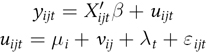
If the time effect is added to the Model 1 where a unit is nested in the other unit, then the model given below is obtained. Here  .
.
(2) 
Multi-dimensional fixed effects models estimations can be made using the least squares with dummy variable (LSDV) method and the within estimation methods. These methods, which are used to estimate usual two-dimensional fixed effects ←15 | 16→panel data models, can be adapted for multi-dimensional panel data models. Multi-dimensional panel data models obtained from nested units may not be estimated by using the LSDV estimation method because of multicollinearity under the assumption of fixed effects. For the multi-dimensional panel data models with nested or grouped units within the other unit, fixed effects estimators can be obtained by within estimation method under the assumption of fixed effects. For the nested fixed effects multi-dimensional panel data model, within estimation method is based on differences from within averages. Nested multi-dimensional panel data models are classified as balanced and unbalanced panel data according to the number of units in which the units (primary unit) are nested. For example, the firms nested within sectors may be different in terms of the number of firms in each sector. In this case, the panel data model is unbalanced in that the sectors include a different number of firms. Firstly, the following multi-dimensional panel data model and the within estimation method for this model are given. The nested panel data model introduced in the section where the fixed effects multi-dimensional panel data models are introduced is given below. In the models, the units are explained based on the example of the firms nested within the sectors.
The within estimation method will be introduced for multi-dimensional unbalanced panel data model, which allows for the number of firms in each sector to be different.
(3) 
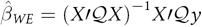
Here  . In order to obtain the two-way fixed effects estimator of the three-dimensional panel data model that does not have the time effect, the transformation matrix is
 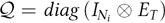 (Baltagi et al., 2001:13). Here
 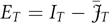 . This transformation matrix provides the within transformation below:
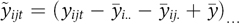
Here  .
.
The same transformation is performed for each explanatory variable in the model.
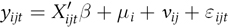
With the addition of the time effect to Model 3 above, a three-way panel data model is obtained and is given below:
(4) 
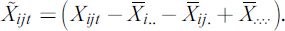
Here  . The within transformation matrix used to obtain the within estimator is described below.

This transformation matrix provides the within transformation as follows:
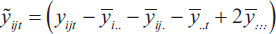
Here in comparison to the transformations of the previous model, the difference is 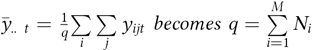 .
.
The same transformation is performed for each explanatory variable in the model.
 .
.
The fixed effects estimator with the transformed variables is expressed in general below.
Multi-Dimensional Random Effects Models and Estimation Methods
The effects that cannot be observed as part of the component error term, rather than as parameters to be estimated, may be included in the model assuming that it is a random variable. Considering the structure of the multi-dimensional panel data model in fixed effects models, assuming the unobservable effects as parameters to be estimated leads to a loss of degree of freedom. This problem is not encountered in models with random effects. However, for the estimators to be unbiased and consistent, in models with random effects, in addition to the assumption that the error term and the explanatory variables are unrelated, the unobservable effects are assumed to be unrelated with the explanatory variables.
In the case of multi-dimensional random effects panel data models, the models can be grouped as major nested and non-nested models according to the nesting a unit within another unit. Matyas et al. (2012), Balazsi et al. (2017a) examined the multi-dimensional random effects panel data models obtained from non-nested units in their studies. In these studies, the models which are the most preferred and estimated under different specifications are introduced and estimation methods are explained in empirical studies related to multi-dimensional random effects panel data models.
The nested random effects panel data models obtained in the sense of grouping one unit within the other unit can also be expressed under different specifications. As in the case of fixed effects models, the random effects models will be defined through the example of sectors and the firms grouped in these sectors. As was mentioned in the fixed effects models, the nested models with more than three dimensions can also be encountered.
←17 | 18→Below is a random effects panel data model with the unit effects in which one unit is nested within the other unit.
(5) 
The unbalanced models due to different number of firms in the sectors are defined as 
 in Model 5 M indicates the sectors and N indicates the firms in those sectors.
  is the unobservable unit effect of the sector and
  is the j. firm’s unit effect in the sector. If the time effect is added to the above-mentioned Model 5, then the model presented below is obtained.
(6) 
Here if the number of firms in the sector is different, then the definition is  . In addition to the estimation that
  for random effect models obtained from nested units, it is estimated that the unobservable effects and the error term by these effects are independent from one another (Baltagi et al., 2001, p.359).
Generalized least squares (GLS) and maximum likelihood estimation (MLE) methods used in known two-dimensional panel data models can be adapted for multi-dimensional random effects models. In the nested multi-dimensional panel data models where one unit is nested within the other unit, the unobservable effect of the nested unit can be considered as a nested effect. In the error components Model 5,  is defined as the unobservable nested effect of j. firm in the i. sector. With the effect of nested effect approach, the random effects panel data models in which one unit is nested within the other unit can be analyzed for balanced and unbalanced panel data models.
It was first proposed by Baltagi (1993) that the unit effect of a unit nested in the other unit could be considered as a nested effect, and then Xiong (1995) also contributed to this. The nested random effects approach by Baltagi et al. (2001) and Antweiler (2001) is also adapted for unbalanced panel data models. These models are unbalanced panel data models in terms of the number of firms in different sectors or different numbers of cities in the regions. The estimation methods proposed by Baltagi et al. (2001) and Antweiler (2001) allow for the estimation of unbalanced panel data models.
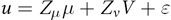
With the nested effect approach, estimation of multi-dimensional random effects panel data models with GLS and MLE methods can be realized. First, the GLS estimation method and the feasible generalized least squares (FGLS) estimation method, which is based on the estimation of the variance components to apply the GLS estimation method, are explained. The compound error term of the error components of Model 5 is described below.
←18 | 19→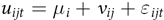
Here  indicates the unobservable sector effect.
  indicates the nested effect or the unobservable nested effect of the j. firm in the i. sector and it has been allowed to use different number of firms in the sectors. The above-described compound error term is described below with matrices.
Here the dummy variable matrices are 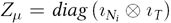 and
and 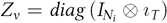 and the variance-covariance matrix of the error term is expressed below (Baltagi et al., 2001, p.359). Here
  is the ones vector and the sizes are arranged according to indexes.

The variance-covariance matrix has been rewritten below for the i. block with the Wansbeek and Kapteyn (1982) approach.

Here when 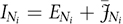 ve
ve 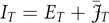 is written and the variance-covariance matrix is organized, the spectral decomposition of the obtained variance-covariance matrix is given below.

The eigenvalues obtained from the spectral separation of the variance-covariance matrix and the corresponding projection matrices are set out below.
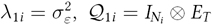

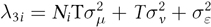 ,
, 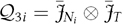 (Baltagi et al., 2001, p.360).
Details
- Pages
- 386
- Year
- 2019
- ISBN (PDF)
- 9783631795705
- ISBN (ePUB)
- 9783631795712
- ISBN (MOBI)
- 9783631795729
- ISBN (Softcover)
- 9783631795682
- DOI
- 10.3726/b15875
- Language
- English
- Publication date
- 2019 (November)
- Keywords
- Time series data Panel data Cross-sectional data
- Published
- Berlin, Bern, Bruxelles, New York, Oxford, Warszawa, Wien, 2019. 386 pp., 44 fig. b/w, 77 tables.
Biographical notes
Ebru Çağlayan Akay (Volume editor) ![]() Özge Korkmaz (Volume editor)
Özge Korkmaz (Volume editor) ![]()
Ebru Çağlayan Akay is a Professor of Econometrics at Marmara University in İstanbul, Turkey. Her major research interests are applied micro econometrics, nonparametric econometrics and panel data econometrics. She has published over 50 academic papers and authored over 10 books. Özge Korkmaz is an Assistant of Professor at Bayburt University in Bayburt, Turkey. She obtained her master’s degree in Econometrics from Dokuz Eylul University in İzmir, Turkey and her PhD from Karadeniz Technical University in Trabzon, Turkey. Her major research interests are applied macro econometrics, financial econometrics and panel data econometrics. She has published over 25 academic papers.
