Research on Optimal Consumption Rate and Steady Economic Growth in China
Summary
Excerpt
Table Of Contents
- Cover
- Title
- Copyright
- About the author
- About the book
- This eBook can be cited
- Contents
- List of Figures
- List of Tables
- Preface
- Introduction
- Background and Some Basic Facts about the Research
- Approach and Methodology
- Definition and Literature Review
- Outline
- China’s Consumption Rate and Economic Growth Steadiness: Stylized Facts
- Features of the Variation in China’s Consumption Rate
- Features of the Steadiness of China’s Economic Growth
- Factors Affecting China’s Final Consumption Rate
- Summary
- Economic Dynamic Efficiency and Optimal Consumption Rate
- Economic Dynamic Efficiency and Its Evaluation Method
- Optimal Consumption Rate and Dynamic Efficiency: Theoretical Framework
- Optimal Consumption Rate and Dynamic Efficiency: Empirical Analysis
- Optimal Consumption Rate and Dynamic Efficiency: Analysis at the Provincial Level
- Conclusion and Policy Suggestions
- Optimal Consumption Rate in the Solow–Swan Model
- Theoretical Framework of Optimal Consumption Rate
- Measurement and Analysis of China’s Optimal Consumption Rate
- China’s Optimal Consumption Rate – Analysis Based on Capital-Output Ratio
- Summary and Policy Suggestions
- Optimal Consumption Rate in the Ramsey–Cass–Koopsman Model
- Analysis Framework for China’s Optimal Consumption Rate: Theoretical Model
- Calculation of China’s Optimal Consumption Rate Based on the Ramsey–Cass–Koopmans Model
- Summary and Policy Suggestions
- Optimal Consumption Rate in an Open Economy
- Determination of Optimal Consumption Rate in an Open Economy
- Numerical Simulation of the Optimal Consumption Rate in an Open Economy
- Summary
- Optimal Consumption Rate in the Dynamic Stochastic General Equilibrium (DSGE) Model
- Theoretical Framework of the DSGE Model
- Numerical Simulation and Dynamic Analysis
- Summary
- Evaluation of the Steadiness of China’s Economic Growth and Analysis of the Factors Affecting It
- Demand Structure and Economic Growth Stability
- Industry Structure and Economic Growth Stability
- Factor Structure and Economic Growth Stability
- Ownership Structure and Economic Growth Stability
- Empirical Analysis of the Factors Affecting the Steadiness of China’s Economic Growth
- Conclusion and Policy Suggestions
- Analysis of the Impact of Final Consumption Rate on Economic Growth and Its Steadiness
- Analysis of the Impact of Increase in Consumption Rate on Economic Growth – from the Perspective of National Accounts
- Impact of Variation in Consumption Rate on Economic Growth – Based on Input-Output Table
- Dynamic Analysis of the Impact of the Increase in Consumption Rate on China’s Economic Growth
- Conclusion and Outlook
- Research Conclusions
- Policy Suggestions
- Deficiency and Outlook
- Appendix
List of Tables
Table 2-2The Variations of China’s Consumption Rate and Capital Formation Rate since 1978
Table 2-3Fluctuation of China’s Consumption Rate during 1978–2020
Table 2-4Statistics of China’s Consumption Rate and the Factors Affecting It during 1990–2016
Table 2-5Result of Unit Root Test (ADF Test)
Table 2-6Result of Johansen Cointegration Test
Table 3-1Dynamic Efficiency of China’s Economy during 1992–2016
Table 3-2Relationship between Dynamic Efficiency and Consumption Rate
Table 3-3Unit Root Test on CR and LIR
Table 3-4Test on the Stationarity of the Residuals with EG Two-Step Approach
Table 3-5Variance Decomposition of CR and LIR
Table 3-6Granger Causality Test on CR and LIR
Table 3-7Correlation Test on China’s Final Consumption Rate and the Dynamic Efficiency
Table 3-8Granger Causality Test on China’s Consumption Rate and Dynamic Efficiency
Table 4-1China’s Economic Statistics during 1978–2013
Table 4-2Result of Unit Root Test (ADF Test)
Table 4-3Result of Johansen Cointegration Test
Table 4-4China’s Optimal Consumption Rate and Relevant Statistics during 1978–2013
Table 4-5Granger Causality Test on Capital-output Ratio and Optimal Consumption Rate
Table 5-1Calibration Results of the Parameters Related to Optimal Consumption Rate
Table 5-2Impact of Various Discount Rates on Optimal Consumption Rate
Table 5-3Impact of Various Coefficient of Relative Risk Aversion on Optimal Consumption Rate
Table 5-4Impact of Various Rates of Technological Progress on Optimal Consumption Rate
Table 5-5Impact of Various Capital Flexibility of Output on Optimal Consumption Rate
Table 5-6Impact of Various Population Growth Rates on Optimal Consumption Rate
Table 5-7Impact of Various Depreciation Rates on Optimal Consumption Rate
Table 6-1Equilibrium Consumption Rate in an Open Economy (Optimal Consumption Rate percent)
Table 7-1Benchmark Values of Parameter Calibration in the Model
Table 7-2Sensitivity Analysis of Steady-State Consumption Rate to Parameters
Table 8-2Growth Rates and the Variation of China’s GDP and the Three Demands during 1978–2020
Table 8-3Result of the Variance Decomposition of the GDP Volatility (Demand Structure)
Table 8-5Growth Rates and the Variation of China’s GDP and the Three Industries during 1978–2020
Table 8-6Result of the Variance Decomposition of the GDP Volatility (Industry Structure)
Table 8-7Average Growth Rates of China’s Factor Inputs in Various Periods
Table 8-8Relevant Economic Statistics of China during 1978–2013
Table 8-9Descriptive Statistics on Economic Fluctuation, Factor Shocks and Structural Variation
Table 8-10Relevant Data of the Empirical Analysis of China’s Economic Growth Stability
Table 8-11Result of Unit Root Test (ADF Test)
Table 8-12Result of Johansen Cointegration Test
Table 8-13Result of the Empirical Analysis of the Factors Affecting Steadiness
Table 9-1Estimation Result of the State-Space Model
Table 9-2Growth Rates of the Three Demands since 1978
Table 9-3Variation Trend of Final Consumption Rate in Benchmark Scenario and Other Three Scenarios
Table 9-4GDP Growth Rates in Benchmark Scenario and Other Three Scenarios
Table 9-7Non-competitive Input-Output Table
Table 9-8Split Non-competitive Input-Output Table of 2012
Table 9-9Final Products in China and the Increased Value Driven by Them in 2012
Table 9-10Domestic Final Products and the Structure in Benchmark Scenario and Simulation Scenario
Table 9-12GDP and Its Structure in Benchmark Scenario and Simulation Scenario
Table 9-14Result of Unit Root Test (ADF Test)
Table 9-15Regression Result of the VAR Model of GR, CR and IR
Table 9-16Variance Decomposition of GR
Preface
Since the start of reform and opening-up, China has maintained an annual GDP growth rate of 9.19 percent. Such rapid growth is known as “China’s economic miracle”; meanwhile, the steadiness of economy growth has been progressively strengthened. According to the research carried out by Lin Jianhao and Wang Jinmei (2013), since 1996, China’s economy has been out of the boom-bust cycle which refers to the alternating phases of economic growth and decline, and it has entered the Great Moderation where the waves of the economic cycle are becoming ripples. However, contrary to the rapid growth and the increasing economic steadiness, the proportion of consumption in GDP, which acts as the most significant indicator of the level of national economic welfare and lays the foundation for the steady economic growth, has been falling year by year with the final consumption rate decreasing from 61.4 percent in 1978 to 54.7 percent in 2020. Does the situation indicate a less impact of consumption on China’s long-term economic growth? Is there an optimal consumption rate contributing to the steady economic growth? What is China’s optimal consumption rate? How can the optimal consumption rate affect economic growth? These questions, both theoretical and practical, need to be figured out to maintain steady economic growth.
Since developed countries have never witnessed a relatively low consumption rate during their economic development, western economics evolved from the experience of developed countries barely has studies specifically on optimal consumption rate. Nevertheless there have been studies on optimal savings rate and optimal investment rate. For instance, Malthus (1798) argued that consumption and investment which are deemed as future productivity are the two sections of output. There must be an optimal ratio between them. Based on such optimal proportion, the sustainability of consumption and the productive capacity of economy need to be fully considered to achieve the greatest growth of wealth (economy); Phelps (1961) established the well-known golden rule of economic growth. When the economy achieved the golden-rule growth, consumer’s level of consumption (utility) is maximized, and the consumption rate at this point is called the optimal consumption rate. Based on the previous research and theories on economic growth, this book uses different measures to obtain China’s optimal consumption rate and analyses how the optimal consumption rate affects economic growth in both theoretical and practical ways. The outline of this book is as follows:
First, based on the previous research carried out by foreign and domestic scholars, this book looks into the issues related to optimal consumption rate within the five theoretical frameworks, namely the economic dynamic efficiency, the Solow–Swan model, the Ramsey–Cass–Koopmans model, the general equilibrium model in an open economy and the Dynamic Stochastic General Equilibrium (DSGE) model. By various methods such as comparative analysis of statistics, regression analysis and parameter calibration, China’s optimal consumption rate can be calculated as follows: (i) Within the framework of the economic dynamic efficiency, the optimal consumption rate is about 55 percent. Though the number is far smaller than the average rate of the world as well as that of the middle-income countries during the corresponding period, the author believes it could be the best performance of the economic entity under the economic conditions during 1992–2016. Accordingly, China’s final consumption rate is just “relatively” low. (ii) Within the framework of the Solow–Swan model, the reasonable range of China’s optimal consumption rate would be [64.9 percent, 67.7 percent], the median of which is about 66 percent, 11 percentage points higher than the optimal consumption rate (55 percent) calculated in the framework of the economic dynamic efficiency. Such difference can be explained by the fact that the Solow–Swan model emphasizes the long-term optimal economic growth while the economic dynamic efficiency stresses both the medium- and short-term growth and economic reality. (iii) Within the framework of the Ramsey–Cass–Koopmans model, China’s optimal consumption rate is calculated to be 62.75 percent with parameter calibration. The impact of technological progress rate, discount rate and consumer’s coefficient of relative risk aversion on optimal consumption rate is positive while that of capital elasticity of output, population growth rate and depreciation rate is negative. (iv) Within the framework of the general equilibrium model in an open economy, through numerical simulation with various parameters, the range of optimal consumption rate is calculated to be [51.1 percent, 80.8 percent]. Based on the premise that all parameters are set according to the economic reality, the median is calculated to be 66.0 percent. In other words, the optimal consumption rate in an open economy is 66.0 percent, which is close to the final consumption rates calculated based on the two long-run growth models: the Solow–Swan model and the Ramsey–Cass–Koopmans model. (v) Within the framework of the DSGE model, through numerical simulation with calibrated parameters, the optimal consumption rate is calculated to be 58.02 percent in a steady-state economy. The number equals to the final consumption rate, consisting of 43.02 percent household consumption rate and 15 percent calibrated government consumption rate. Given the fact that the average final consumption rate of China during 1978–2016 is 58.7 percent, the calculated result is close to China’s actual final consumption rate.
The above calculations of China’s optimal consumption rate based on the five models indicate the following: On the one hand, the dynamic efficiency model and the DSGE model accentuate the short-run character of China’s economic reality and measure the level of final consumption (55 percent and 58.02 percent, respectively). The calculated result could be a short-term goal of demand structure adjustment in The 13th Five-Year Plan. The convergence from 53.6 percent in 2016 towards the optimal value helps motivate the consumption which is a driving force of economic growth and meanwhile strengthens the stability of economic growth to some extent. On the other hand, models of economic growth including the Solow–Swan model, the Ramsey–Cass–Koopmans model and the general equilibrium model in an open economy highlight the character of China’s economic reality regarding the long-term optimal growth. Considering the result obtained based on the three models and judging from the point of view of long-run growth, the reasonable range of optimal consumption rate is [62.75 percent, 67.7 percent], which could be a long-term goal of China’s demand structure adjustment.
Next, following the calculation of China’s optimal consumption rate, this book assesses China’s economic growth stability with empirical evidence and analyses the main factors affecting it. The conclusion is as follows: China’s economic growth stability in both demand and supply is gradually improving, which is in line with the argument held by the domestic scholars in relevant field that China’s economy has entered the Great Moderation; judging from the factors affecting economic growth stability, the evolution of demand structure has intensified economic volatility to some extent while adjustments in factor structure, industry structure and ownership structure increase economic growth stability to a certain degree.
Furthermore, this book offers statistics-based analysis of how the increase of final consumption rate affects economic growth and its steadiness from the following three aspects: (i) National accounts. Supposing the growth rate of consumption, investment and net export remains the same along with an increased consumption rate, a decreased investment rate and an unvarying net export rate, this book simulates the impact of changing final consumption rate on economic growth and its steadiness. The result shows that rise in consumption rate has much smaller impact on economic growth rate than it does on the stability of economic growth rate; (ii) Input and output. Supposing consumption rate goes up with a declining investment and a dropping net export rate, a rise in final consumption rate affects economic growth rate slightly; (iii) Vector Autoregression (VAR) model. The VAR model of final consumption rate, investment rate and economic growth rate based on the statistics in China from 1978 to 2016 is used to analyse the impact of varying consumption rate on economic growth and its steadiness. It can be concluded as follows: economic growth rate varies slightly to respond to a shock of final consumption rate; according to the result of the variance decomposition of economic growth rate and final consumption rate, the volatility of economic growth rate mainly comes from itself, which indicates variation in final consumption rate has minor impact on economic growth rate.
Finally, based on the research findings, this book puts forward the proposition that China’s final consumption rate should converge towards the optimal value in order to maintain steady economic growth.
Chapter 1
Introduction
1.1 Background and Some Basic Facts about the Research
1.1.1 Background
Learning from the experience of developed countries, we can see that normally consumption rate accounts for about 70 percent in GDP. Such a high share indicates that consumption, as one of the “Troika” (investment, consumption and exports) that drives economic growth, contributes greatly to the steady economic growth of a country. Since the reform and opening-up, China has made astonishing economic achievements. According to Figure 1-1, during 1978–2020, the annual GDP growth reached 9.19 percent1, and the average contribution rate of final consumption to economic growth touched 57.4 percent. Figure 1-2 demonstrates final consumption drives 5.30 percentage-point increase in economic growth on average annually. These statistics show that the stable final consumption lays the solid foundation for China’s continuous and rapid economic growth.
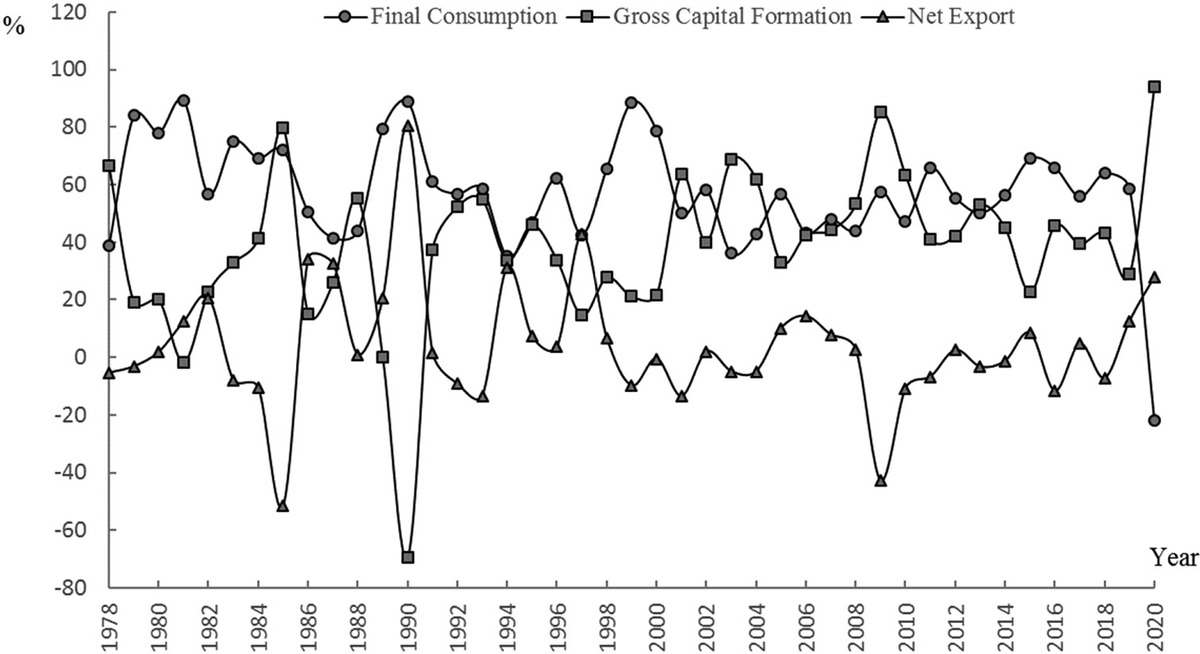
Figure 1-1The Contribution Rates of Final Consumption, Gross Capital Formation and Net Export to China’s Economic Growth
Source: Database of National Bureau of Statistics of China
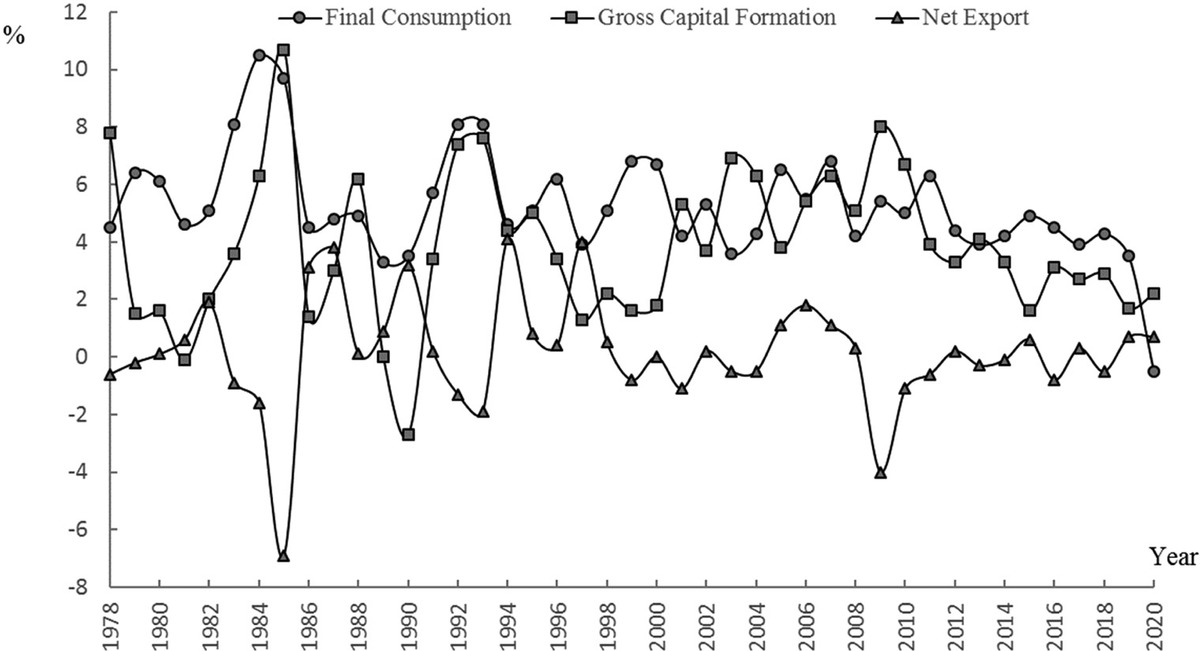
Figure 1-2China’s Economic Growth Driven by Final Consumption, Gross Capital Formation and Net Export
Details
- Pages
- XXII, 444
- Publication Year
- 2023
- ISBN (PDF)
- 9781636672670
- ISBN (ePUB)
- 9781636672687
- ISBN (Hardcover)
- 9781433197918
- DOI
- 10.3726/b22122
- Language
- English
- Publication date
- 2024 (April)
- Keywords
- China's economy Long-term stable economic growth Optimal consumption-rate in China
- Published
- New York, Berlin, Bruxelles, Chennai, Lausanne, Oxford, 2024. XXII, 444 pp., 63 b/w ill., 63 tables.
- Product Safety
- Peter Lang Group AG
